Examining Taubman’s Performance
2018-05-01
Recent reviews from Bloomberg, Inc. and Land & Buildings Investment Management illustrate a bleak picture for The Taubman Company. Its consistent decline as a super-regional, outlet shopping center owner may have been avoided.
(RE)meter analysed many of Taubman’s tenants to reveal the inherent high risk that has landed the company under industry microscopes.
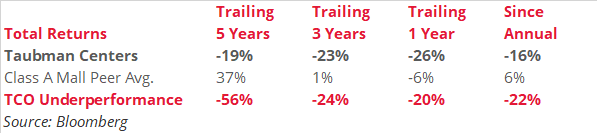
Among its peers over a five-year period, Taubman experienced negative returns while the industry overall averaged positive returns, according to Bloomberg, Inc. The resulting underperformance of Taubman Centers is staggering, ranging between -20% and -56% since 2013.
Regarding Taubman’s track record and continued underperformance, Land & Buildings Investment Management, a REIT investor and shareholder of Taubman, identified some of Taubman’s issues as follows:
- The troubling pattern of poor shareholder returns, disappointing operating results, and perplexing capital allocation decisions have been permitted to persist at Taubman.
- The company has a long history of stock price underperformance, as it has been outperformed by its Class A Mall Peers by 56%, 24%, and 20% over the past 1, 3, and 5 years, respectively.
- Taubman’s best-in-class portfolio continues to generate lackluster operating results. Its same store net operating income of only 0.7% in 2017 is 180 basis points below its Class A Mall Peers, releasing the worst spreads amongst its Class A Mall Peers.
- Taubman’s balance sheet remains overleveraged for even longer than it had anticipated, with debt to EBITDA not expected to reach its targeted range of 6-8x until 2020 versus prior expectations of 2019.
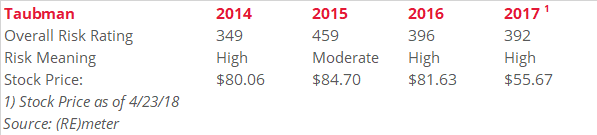
When (RE)meter put Taubman to the test, these issues and others became more clear. (RE)meter rated and compared the company’s financial strength, the economic health of its industry, and rent affordability against 31,389 U.S. establishments, all competing within the specific industry category of “531120- Lessors of Nonresidential Buildings (except Mini warehouses).” With the exception of 2015, the last four years show a risk of “high.”
Taubman Tenant Review
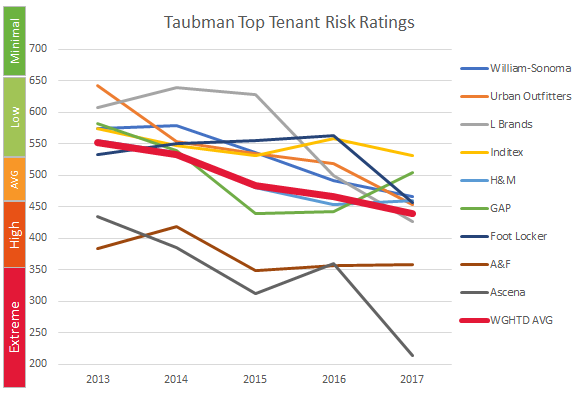
To further assess Taubman’s portfolio, (RE)meter weighted nine retailers by lease square footage of TCO’s portfolio. (RE)meter found the combined tenants rate as high risk in 2017, as opposed to its low risk rating in 2013.
This may be an impairment to Taubman as it depends on national retailers to draw mall traffic just like department store mall anchors. Unlike department stores, inline tenants pay significantly higher rental rates. Therefore, declining long-term performance may affect the company’s future rental and occupancy rates relating to these tenants leasing decisions.
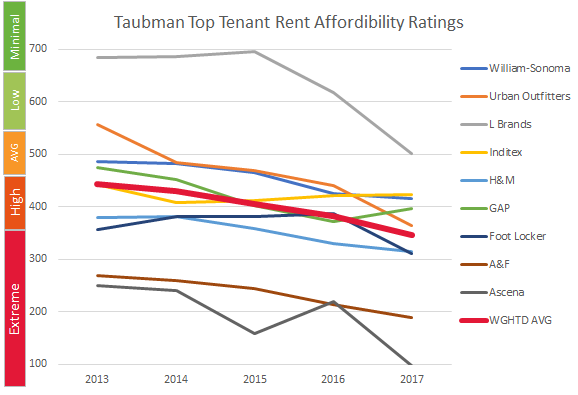
Even worse news for The Taubman Company is the reality that tenants like these are increasingly challenged to afford their leased space rent. (RE)meter’s ratings show rent affordability has been declining since 2013, bordering a weighted average of extreme risk in 2017. Unfortunately, for companies like Taubman, many of these tenants are considered high to extreme risk.
(RE)meter’s “high risk” ratings and TCO’s declining stock price are also reflecting investors diminished expectations of future returns.
Why is Taubman experiencing poor returns in a best-in-class portfolio? One of the main reasons, which is rarely explored by the CRE industry, is looking at a REIT’s tenants and underlying industries. In the age of transforming and declining retail industries, TCO’s underlying tenancy has declined in overall credit quality and performance.
(RE)meter rated the top nine public tenants of the Taubman portfolio, which comprises of approximately 20% of its leased SF.
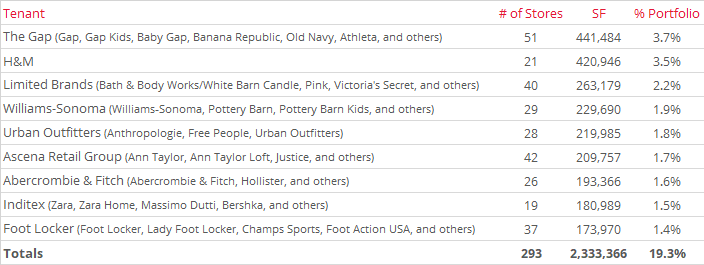
TCO has bet on these retail tenants to maintain mall traffic, sales, and, ultimately, rent levels. However, this strategy has yielded the company increasingly less profitability. In addition, all these well-known brands have been declining and performing worse than their industry peers since 2013.
How Did (RE)meter See What Others May Have Missed? The primary reason is market saturation as expansion of store locations has diluted EBITDA and net income of these tenants. Because (RE)meter was able to rate Taubman and its tenants not only its financial strength but also on the economic health of its industry and rent affordability against all other establishments in each retailer’s industry, (RE)meter saw the big picture.
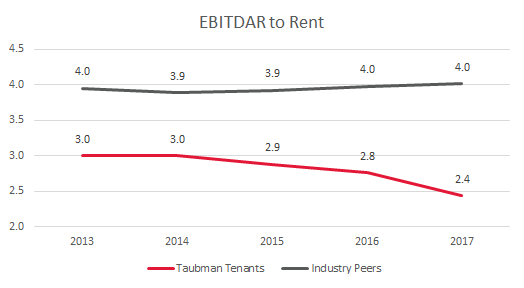
(RE)meter compared these nine tenants in aggregate against their combined underlying industries. EBITDA margin has declined from 17.6% in 2013 to 12.9% 2017 while its peer combined industries has maintained at 20.8%.

Additionally, the combined tenants reveal severe declines in rent affordability while the tenant industries show improvement.
“The ability to understand how tenants’ industries perform economically—both nationally as well as locally—empowers CRE owners and investors to be more proactive and strategic for leasing decisions on a portfolio level,” says Scott Openlander, Co-Founder of (RE)meter. (RE)meter can measure the economic performance and risk of any industry including W2 employment trends.
About Us (RE)meter is a technology venture disrupting an insufficient underwriting process in Commercial Real Estate. (RE)meter’s TIL Score, Industry Reports and Building Diversification Reports utilize certified-government data to produce smarter and more efficient leases. (RE)meter is the #1 lease risk partner for CRE professionals, nationwide. Contact Info@re-meter.com to learn more.